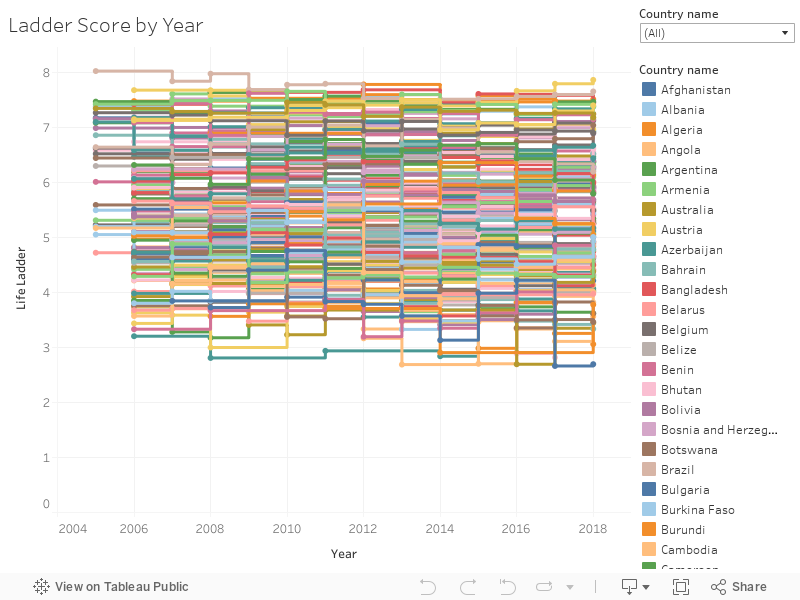
This line graph examines how countries climb up or down the happiness rankings over time, as measured by the Cantril ladder score. Interact with the graphic to see how countries of interest to you rank.
Our data set contains information on 153 countries, sourced from:
A country’s happiness is measured by its “ladder score,” calculated by averaging its surveyed residents’ individual answers to the following GWP question:
“Please imagine a ladder, with steps numbered from 0 at the bottom to 10 at the top. The top of the ladder represents the best possible life for you and the bottom of the ladder represents the worst possible life for you. On which step of the ladder would you say you personally feel you stand at this time?” (Gallup, Inc. 2020).
This line graph examines how countries climb up or down the happiness rankings over time, as measured by the Cantril ladder score. Interact with the graphic to see how countries of interest to you rank.
The WHR then uses regression to explain the resulting ladder scores using six key variables, which are calculated from GWP questions or sourced from public information. When taken together, the adjusted R-squared for the model was 0.745, explaining a significant amount of global happiness (Helliwell et al. 2020, 15).
This is the natural log of a nation’s reported gross domestic product (GDP) value, measured per person. “The GDP per capita variable is in terms of Purchasing Power Parity (PPP) adjusted to constant 2011 international dollars, taken from the World Development Indicators (WDI) released by the World Bank on November 28, 2019.” (Helliwell et al. 2020, 17)
The national average of binary responses to the GWP question, “If you were in trouble, do you have relatives or friends you can count on to help you whenever you need them, or not?” (Helliwell et al. 2020, 17)
“The time series of healthy life expectancy at birth are constructed based on data from the World Health Organization (WHO).” The time series of life expectancies, with no adjustment for health, are available in WDI. (Helliwell et al. 2020, 17)
This is the national average of binary responses to the GWP question, “Are you satisfied or dissatisfied with your freedom to choose what you do with your life?" (Helliwell et al. 2020, 17)
Generosity is the residual of regressing the national average of GWP responses on GDP per capita. Surveyed individuals answered the question, “Have you donated money to a charity in the past month?” (Helliwell et al. 2020, 17)
“Perceptions of corruption are the average of binary answers to two GWP questions, “Is corruption widespread throughout the government or not?” and “Is corruption widespread within businesses or not?” Where data for government corruption is missing, the perception of business corruption is used as the overall measure.” (Helliwell et al. 2020, 17)
These six factors are utilized on the basis that prior research literature found them “to be important in explaining national-level differences in life evaluations” (World Happiness Report 2020). The WHR excluded other important variables, such as inequality and unemployment, due to a lack of proportionate international data for their entire sample of nations. Regardless, they acknowledge that the variables they did choose are meant to demonstrate correlation rather than outright causation.
Where does our data come from?
The Gallup World Poll is the WHR’s primary data source. Gallup created its poll to research various matters that concern our global population, covering topics such as finances and happiness. The company believes they can “help change the world by finding out what each of the world's 7 billion+ citizens think, feel and desire” (Gallup, Inc. 2020, under “Impact”), asserting that they are the only entity that can reach every human being on the planet. The GWP is completed each year, typically surveying individuals across 160 nations and accounting for approximately 99% of the global population (Gallup, Inc. 2020). Gallup presents a survey of around 100 questions, with some additional region-specific queries included as well.
Who is eligible to participate in the Gallup Poll?
The Gallup World Poll typically surveys at least 1,000 individuals from over 160 countries. Surveyed individuals are non-institutionalized, at least 15 years old, and a registered civilian.
How is data collected for the Gallup Poll?
The GWP utilizes the Cantril ladder methodology when surveying individuals. This method of scaling is what guides the question (mentioned above) which helps researchers create the nationally averaged “ladder score” values. It asks respondents to imagine the greatest possible life for themselves and rank their reality on a scale from 0 to 10, with 0 being the worst possible situation and 10 being the best (The World Happiness Report). The limitations of this methodology lie in the concept that “...humans employ the ‘imagined wellbeing’ as a background or benchmark against which to evaluate definite… wellbeing” (Khalil, 2018). In other words, the question doesn’t actually ask respondents to report their current happiness, it asks that they do so in comparison with an imagined amount of happiness. Humans are constantly aspiring to have more. Because of this, they may never feel that they are sufficiently “happy” because they are not as happy as they think they could or should be. That is one limitation of the GWP’s methodology, as it incorporates aspirational values and subsequently limits the happiness respondents can report.In terms of how they choose to conduct their interviews, in countries where at least 80% of the population has telephone coverage, surveyors conduct 30-minute telephone interviews. In “developing” countries, Gallup randomly selects households to conduct hour-long face-to-face interviews (Gallup, Inc. 2020). Both types of interviews are conducted in languages specific to that nation (Gallup, Inc. 2020). However, in those developing countries, the sample from which they randomly select respondents is limited, leading to immediate silences in the data. Because they use face-to-face interviews here, Gallup excludes people in “high risk” or difficult-to-reach regions of a country (Gallup, Inc. 2020). For example, in Mali, about 23% of the total population was not represented. Some regions were considered “security” risks, and some “[villages] with less than 50 inhabitants” were excluded. In Singapore, from 2005 to 2019, about 12% of the population could not be reached due to their “restricted access” to some condominiums (Gallup, Inc. 2020). As for silences in the more developed countries, low income households who do not have telephone coverage are not represented in the data.
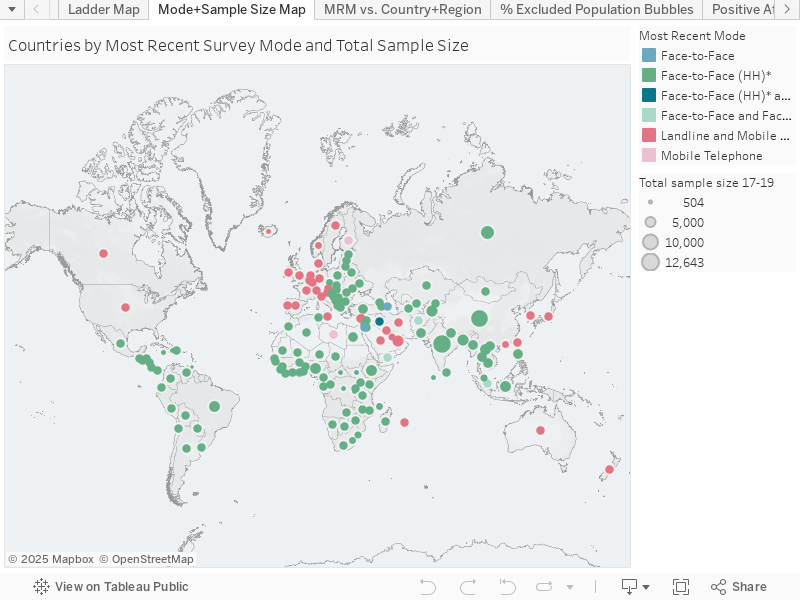
This interactive symbol map visualizes the relationship between a country’s survey mode and its geographic location. The size of the bubble corresponds to the total sample size over years 2017-2019. When scrolled over, the total sample size is broken down by year, revealing inconsistencies in data collection.

This interactive stacked bar graph reveals the number of countries assigned to a geographic “region” and their mode of interview, colored by mode of interview. The relationship between mode of interview and region is more clearly quantified by this graph than the maps.
How is the World Happiness Report funded?
The data set project is funded by the Centre for Economic Performance at the London School of Economics and Political Science, Wellbeing Research Centre at University of Oxford, Canadian Institute for Advanced Research, and Vancouver School of Economics at University of British Columbia. Research grants were given by the Ernesto Illy Foundation and illycaffè, a company known for its coffee. Other organizations include Comfort Zone, an Italian skin care company under Davines Group, and Unilever’s ice cream brand, Wall’s. Blue Chip Foundation, an organization dedicated to U.N. sustainable development goals, and the William, Jeff, and Jennifer Gross Family Foundation were partners of the Sustainable Development Solutions Network (The World Happiness Report 2020). The data includes biases of its funding organizations, such as that of the Blue Chip Foundation.
In creating the World Happiness Report data, some imputation was used where missing values for the six variables were found, such as by using other methodologies (e.g. “control of corruption” indicator from the Worldwide Governance Indicators (WGI) project), or the country’s most recent values from past years (Helliwell et al. 2020, 4). Additionally, while some data can be estimated, some may not be present at all. Significant variables such as unemployment and inequality were not included in the data set, however, this is because there is not an equal amount of data across countries. The data set also doesn’t include other variables such as land type (presence of rural vs. urban landscapes), which could indicate how proximity to others, or a “fast-paced” vs. “slow-paced” life distinction, factors into individual happiness. Gallup’s data is also proprietary, so microdata for the Gallup World Poll is not publicly available. The data that is publicly available is sufficient, but this barrier raises questions about data as a commodity, the need for open data to support transparency in research, and potential silences that are created by limiting access.
Additionally, the report is partially funded by two Economics-based research centres, giving us reason to believe that the data and the WHR’s explanation of “happiness” is driven by this subject and its motivations. Their Economics focus makes their study of happiness questionable, as finances tend to guide wellbeing rather than the fleeting state of happiness.
Due to some of the limitations and silences we found in the data, we chose to consider additional statistics from the World Bank and World Health Organization, as well as We Are Social and Hootsuite’s Global Digital Overview for 2020. These datasets are included in our primary Google Sheets spreadsheet. Each of these additional datasets is subject to its own individual critiques and are included here to investigate any additional correlations we can find that were not considered in the WHR. As a result, the additional datasets are referenced with limited frequency in our critical analysis.

This packed circle diagram shows a country’s percentage of excluded population (through the size of the bubble), organized and colored by region relative to other countries with excluded or replaced populations. Note that Western Europe and ANZ are both omitted, as none of either region’s population was excluded in any systematic way. We explore the implications of exclusion below.
How ontologies are defined and how individuals or groups reach an ideological perspective are not simply open to interpretation but are shaped over time, as with history, by dominant perspectives. Despite claiming a global view of happiness, the WHR’s ontology uses Western definitions for some categories that might not only exclude measures of well-being in non-Western belief systems but also exclude populations in Western countries that don’t fit within traditional ontologies for measurement. For example, the survey focuses on households (which excludes the unhoused), “registered” civilians (which excludes undocumented residents), and non-institutionalized persons (which excludes the incarcerated). Surveys may require phones, which some people may not have access to. Surveys take an hour when they are conducted in person, which skews results toward people with the luxury of time in countries that are less likely to be taking the survey on the phone. These factors lead to an ontology of well-being that inherently excludes people within each of these countries who may be prone to unhappiness, or who may experience happiness outside of their material circumstances.